
Distance from the central business district typically reduces raw land price, but for luxury condominium sites that relationship is often secondary to transit connectivity, amenity quality, and zoning potential. Federal Reserve hedonic research across 23 U.S. metro areas puts the median residential distance gradient at roughly −0.35, meaning doubling your distance from the CBD cuts land value by about one-third in the median market. That is a meaningful baseline. What it does not capture is how quickly a single transit node, a curated amenity stack, or a favorable floor-area-ratio change can override that gradient entirely.
For luxury condo investors, the practical takeaways are:
- Transit access beats straight-line distance. A site 2 miles out with a direct rail link often prices above a site 1 mile out that requires a car.
- Amenity premium is real and measurable. Cushman & Wakefield data shows high-rise lifestyle renters carry a rent-to-income ratio of roughly 21%, versus 23% for low-rise renters, signaling that affluent tenants pay for the product, not just the address.
- Zoning and height limits can invert the gradient. Where vertical development is capped near the CBD, constrained supply can depress land value relative to unconstrained suburban sites.
- Connectivity is the multiplier. Onemarinagardens sits 160 meters from Marina South MRT, giving residents direct CBD access and effectively compressing the distance premium gap.
Pro Tip: When comparing sites, calculate door-to-door commute time to the nearest major employment node rather than straight-line distance. A 12-minute train ride beats a 25-minute drive every time in a luxury renter's calculus.
Table of Contents
- How does distance from the CBD affect land price?
- What modifiers weaken or reverse the distance-price gradient?
- Why travel time beats straight-line distance as a valuation metric
- What studies actually say about the scale of the distance effect
- How to evaluate a luxury condo site: a due-diligence checklist
- When connectivity and amenities preserve premium despite distance
- Key Takeaways
- How Onemarinagardens reads distance signals when advising buyers
- Useful sources and further reading
How does distance from the CBD affect land price?
CBD proximity raises land value because accessibility reduces commuting costs and concentrates demand in a limited supply zone. The underlying logic is the bid-rent model from urban economics: households and firms bid more for land closer to the center because every additional kilometer of distance adds real cost, whether in commuting time, fuel, or lost productivity. Developers respond by paying more for central land precisely because they can build denser there and recover the premium through higher per-unit prices.
The mechanism works through three reinforcing channels:
- Commuting cost capitalization. Buyers discount future commuting costs into their offer price, so land near the CBD absorbs that saving as a premium.
- Density potential. Where floor-area ratios are generous, developers can spread a high land cost across more saleable square footage, justifying a higher bid.
- Agglomeration and demand concentration. Employment, retail, and services cluster near the CBD, making central locations self-reinforcing in their appeal.
Statistic: The Federal Reserve's hedonic analysis across 23 MSAs finds a median residential land gradient of approximately −0.35. In practical terms, doubling your distance from the CBD reduces land value by roughly one-third in the median metro area.
Real cities are rarely this clean. Empirical work expanding the monocentric model shows that transit proximity, direction from the CBD, and local fixed effects all shift the gradient materially. Polycentric cities with multiple employment hubs, like Los Angeles, can show near-zero or even positive distance coefficients for the traditional CBD once subcenter effects are controlled for.
What modifiers weaken or reverse the distance-price gradient?
Distance matters, but it is routinely outweighed by factors that are easier to change than geography. Investors who treat the CBD gradient as a fixed rule will misprice sites in both directions.
The most consequential modifiers:
- Transit connectivity and travel time. A direct rail link compresses effective distance. Research on polycentric city structures confirms that transportation corridors create local premiums that break the smooth distance-decay curve.
- Amenity and lifestyle offering. Cushman & Wakefield's urban comeback analysis found that walkable urban places occupy roughly 3% of land but account for about 25% of real estate value in some analyses, a concentration that persists even after economic shocks.
- Zoning and height limits. The RBA's urban structure research shows that binding floor-area-ratio constraints near the CBD can suppress land value there relative to unconstrained suburban parcels, inverting the expected gradient.
- Edge cities and suburban subcenters. Secondary employment hubs create their own bid-rent gradients, pulling value away from the traditional CBD axis.
- Coastal and topographic premiums. RBA data for Sydney and Perth shows waterfront suburbs command roughly 50% price premiums independent of CBD distance.
- Macroeconomic cycles. Rising transport costs steepen the gradient; remote-work normalization flattens it. Neither effect is permanent.
Statistic: High-rise lifestyle renters in amenitized urban buildings carry an average rent-to-income ratio of ~21%, versus ~23% for low-rise renters, with average CBD apartment rents approaching $3,000 per month in Cushman's analysis. Affluent renters are paying for the product, not just the zip code.
Pro Tip: Watch for announced transit node additions or municipal FAR upzoning proposals. Either can flip a site's value gradient faster than any organic price appreciation cycle. A planned MRT stop within 200 meters is often worth more than a full kilometer of CBD proximity.
Why travel time beats straight-line distance as a valuation metric
Straight-line distance is the easiest number to calculate and the least predictive of actual price. What buyers and renters pay for is accessibility, and accessibility is measured in minutes, not miles. Studies adding transit dummies and direction variables to standard distance models consistently show that travel time and multimodal connectivity explain price variation better than raw distance.
The practical measurement hierarchy for investors:
- Scheduled transit travel time to the nearest major employment node (peak hour, door-to-door)
- First- and last-mile quality: is the walk to the station pleasant, covered, and under 5 minutes?
- Service frequency: a 3-minute headway is categorically different from a 15-minute one for daily commuters
- Planned infrastructure: confirmed future stations or line extensions that will reduce travel time
- Pedestrian and cycling environment: walkability scores correlate with location-driven value factors that persist across market cycles
Pro Tip: Use a transit authority's journey planner to run both peak and off-peak trips from the site to the CBD. A site that adds 8 minutes off-peak but 22 minutes at peak is a commuter liability. The peak-hour number is what tenants experience every workday.
What studies actually say about the scale of the distance effect
There is no single universal percentage. The effect varies by city size, transit quality, regulatory environment, and economic cycle. That said, the academic and institutional literature gives a useful order of magnitude.
| Source | Key Finding | Investor Implication |
|---|---|---|
| Federal Reserve (FRB), 23 MSAs | Median residential gradient ≈ −0.35; doubling distance ≈ one-third price reduction | Baseline for modeling CBD proximity premium in large U.S. metros |
| RBA urban structure paper | Binding height/FAR limits near CBD can suppress central land value; removing constraints raises it substantially | Always check zoning before assuming CBD proximity = value |
| Cushman & Wakefield | Lifestyle renters in high-rise buildings: ~21% rent-to-income vs. ~23% low-rise | Amenity-rich urban product attracts less rent-burdened, higher-income tenants |
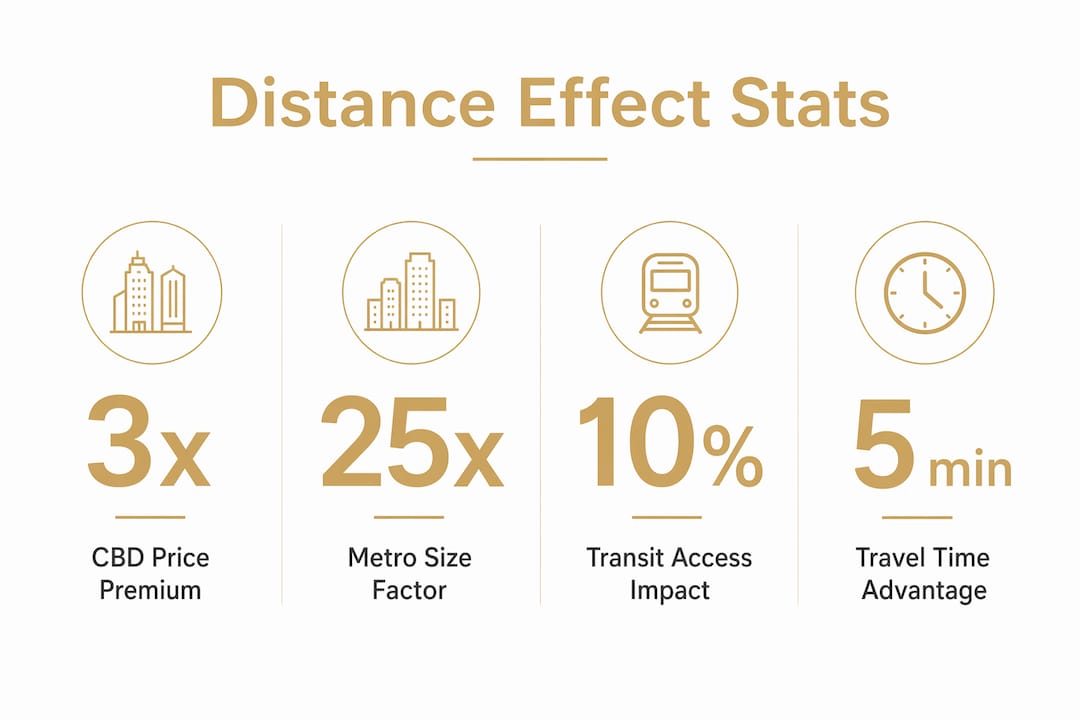
In the largest U.S. metro areas, land prices at the CBD run roughly 3 times higher than mid-tier metros and about 25 times higher than the smallest markets. Between 2012 and 2019, the gradient in the largest metros actually steepened, with close-in locations appreciating faster than suburban ones. That trend is not guaranteed to continue, but it confirms that CBD proximity has compounded, not eroded, in supply-constrained large cities over the medium term.
How to evaluate a luxury condo site: a due-diligence checklist
Prioritize connectivity, amenity quality, regulatory upside, and tenant income profile over raw distance. Here is the sequence that matters:
- Measure door-to-door commute time from the front door to the nearest major employment node at peak hour. Target under 20 minutes for a luxury positioning.
- Confirm transit quality and pipeline. Check station proximity, service frequency, and any confirmed infrastructure projects that will improve access.
- Check zoning and FAR. Understand the current height limit and whether upzoning is politically plausible. A binding FAR near the CBD is a red flag, not a premium signal.
- Evaluate the amenity set. Sky terraces, lap pools, concierge services, childcare, and retail within the development all support a lifestyle premium. Review the full facility list for any project you are comparing against.
- Analyze the tenant income profile. Model rent-to-income ratios for your target tenant. A ratio below 25% signals a financially stable renter base with room to absorb rent growth.
- Stress-test on macro scenarios. Run the numbers at higher transport costs and at interest rates 150–200 basis points above current levels. If the investment only works in the base case, it is fragile.
Red flags to watch for:
- Binding low FAR in a CBD-adjacent zone with no upzoning pathway
- Road or construction projects that will reduce walkability for 3 or more years
- Weak rental enquiry relative to comparable towers at launch
- Per-square-foot asking price that cannot be justified by recent comparable transactions adjusted for amenity differences
Pro Tip: When comparing per-square-foot prices across towers in the same district, adjust for amenity differences before drawing conclusions. A development with a 50-meter lap pool, multiple sky terraces, and a childcare center is not directly comparable to a bare-bones tower at the same address. Use the current price list as your market anchor, then adjust comparables up or down based on facility gaps.
When connectivity and amenities preserve premium despite distance
The clearest real-world illustration of how transit and amenities can substitute for a pure CBD address comes from Singapore's own Marina South precinct. Onemarinagardens sits in District 01, approximately 160 meters from Marina South MRT, with direct rail access to the CBD and Orchard Road. The development combines sky terraces, a 50-meter lap pool, a childcare center, retail, and restaurant space within a single mixed-use environment.

What that combination does to the distance-price relationship is instructive. The site is not inside the traditional CBD core, yet its connectivity and amenity mix place it squarely in the category that Cushman & Wakefield identifies as a walkable urban place: a dense, amenitized hub that concentrates real estate value disproportionate to its land area. The lesson generalizes: a well-connected, amenity-rich site outside the CBD can command pricing that a poorly connected site inside the CBD cannot.
For investors comparing D01 micro-locations, the Marina South connectivity profile is the benchmark to beat, not just the CBD boundary line. Understanding Onemarinagardens as an investment means reading the transit map and the facility list together, not just the map alone.
Key Takeaways
Distance from the CBD reduces land price in most markets, but transit access, amenity quality, and zoning potential regularly override that gradient for luxury condominium sites.
| Point | Details |
|---|---|
| Median distance gradient | Federal Reserve research puts the median residential gradient at −0.35; doubling distance reduces land value by roughly one-third in the median market. |
| Transit beats mileage | Door-to-door travel time and service frequency predict price better than straight-line distance in most empirical models. |
| Zoning can invert the gradient | Binding FAR or height limits near the CBD can suppress central land value; always check regulatory constraints before pricing proximity. |
| Amenity premium is measurable | High-rise lifestyle renters average ~21% rent-to-income versus ~23% for low-rise, confirming that affluent tenants pay for the product. |
| Connectivity multiplies value | Sites like Onemarinagardens, 160 meters from Marina South MRT, demonstrate that a strong transit link compresses the effective distance premium gap. |
How Onemarinagardens reads distance signals when advising buyers
The distance gradient is a starting point, not a verdict. When evaluating units in D01 micro-locations, the signals that carry the most weight are MRT proximity, confirmed infrastructure pipeline, and the amenity gap between competing towers, in that order. Raw meters from the CBD boundary matter less than whether a buyer can reach Raffles Place in under 15 minutes without a car.
The practical signals worth tracking: Marina South MRT ridership growth, rental enquiry volumes for comparable new-launch towers, and any announced municipal projects that will add retail or public space to the precinct. Each of these moves the effective demand curve independently of the distance gradient.
Pro Tip: When comparing per-square-foot prices across D01 towers, isolate the amenity delta first. A development with a 50-meter lap pool, sky terraces, and an on-site childcare center carries a justifiable premium over a tower with a standard gym and rooftop garden. Price the amenity gap before you price the distance gap, or you will systematically underpay for quality and overpay for address.
For buyers ready to run those numbers against real unit prices, the Onemarinagardens price list and contact page are the fastest starting points.

Useful sources and further reading
| Source | What it contains |
|---|---|
| Federal Reserve FEDS 201016 | Hedonic regressions across 23 U.S. MSAs; median residential distance gradient of −0.35 |
| RBA Research Discussion Paper | Urban structure and housing prices in Australian cities; zoning and height-limit effects on the distance gradient |
| Cushman & Wakefield: Urban Comeback | Post-pandemic CBD multifamily data; rent-to-income ratios for high-rise vs. low-rise renters; WalkUP value concentration |
| Duke monocentric model expansion | Empirical work adding transit, direction, and fixed effects to standard distance models |
| ScienceDirect: CBD topic entry | Overview of polycentric and hybrid spatial models that qualify the simple distance-decay baseline |
Additional Onemarinagardens resources:
- Location and MRT connectivity
- Project fact sheet and amenity list
- Unit prices and availability
- Home value factors for buyers and sellers
Recommended
- One Marina Gardens vs Marina One Residences — Which D01 Condo to Buy in 2026?
- Is One Marina Gardens a Good Investment? Marina South Growth Story (2026)
- One Marina Gardens Price List 2026 | Units & Available Prices from $1.81M
- One Marina Gardens Fact Sheet | Project Specs, Facilities & Unit Distribution