
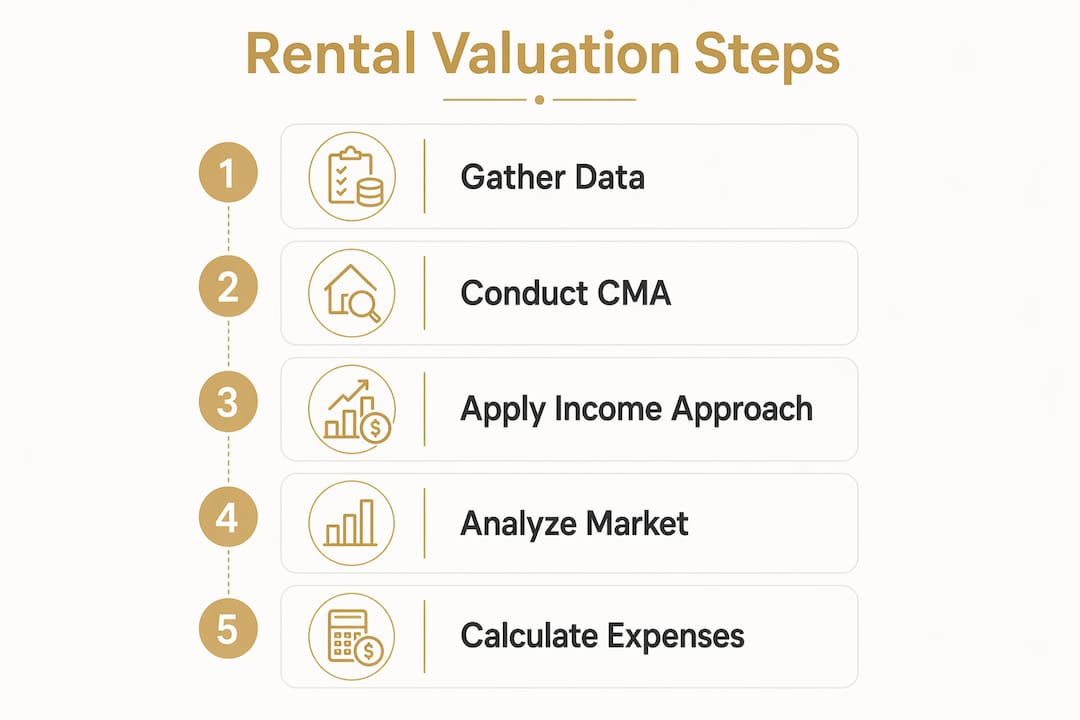
Assessing the rental value of a property means determining the fair market rent a landlord can realistically charge under current local conditions. Two methods dominate professional rental property valuation: Comparable Market Analysis (CMA) and the Income Approach. Both are grounded in real data, not guesswork, and together they give property owners and investors a defensible rent estimate before signing a lease or making a purchase decision. This guide walks you through each method step by step, with the financial metrics and market checks that separate accurate valuations from costly mistakes.
How to assess rental value of a property: the two core methods
Rental value is defined as the highest rent a willing tenant would pay and a willing landlord would accept in an open market. That definition matters because it anchors your analysis in market reality, not wishful thinking. CMA is the most reliable method for estimating rental value, using 3–5 comparable properties matched by type, size, age, and amenities. The Income Approach works from the other direction, calculating what rent a property must generate to justify its price and operating costs.
Neither method works well in isolation. CMA tells you what the market will bear. The Income Approach tells you whether that rent actually produces positive cash flow. Investors who skip one of these checks routinely overpay or underprice their units.

What data do you need before assessing rental value?
Good rental valuation starts with the right inputs. Garbage data produces garbage rent estimates, regardless of how carefully you run the math. Public sources cover most of what you need without paying for expensive proprietary platforms. Publicly available data with proper filtering is sufficient for a defensible rental property valuation.
The table below summarizes the key data points and where to find them.
| Data Point | Purpose | Where to Find It |
|---|---|---|
| Comparable rental listings | Establish market rent range | Local listing platforms, property managers |
| Vacancy rates | Measure supply and demand balance | U.S. Census Bureau, local market reports |
| HUD Fair Market Rents | Benchmark for affordable housing markets | HUD.gov annual FMR tables |
| Operating expense estimates | Calculate Net Operating Income | Property management quotes, tax records |
| Median household income | Test rent affordability and demand risk | U.S. Census American Community Survey |
| Recent lease comps | Verify asking rents against actual signed rents | Local property managers, county records |
Beyond the table, you need two practical tools: a basic rental income calculator and a list of at least two local property managers you can call for a reality check. Finding local property managers before valuation reduces management risk and stabilizes your cash flow forecasts from the start.
How do you conduct a CMA to estimate market rent?
A Comparable Market Analysis for rental valuation follows a clear five-step process.
- Identify 3–5 comparable properties. Match by property type, square footage, number of bedrooms, age, and neighborhood. A 2-bedroom condo in a transit-connected district should be compared only to other 2-bedroom condos in similar locations, not to suburban townhouses.
- Adjust for feature differences. CMA adjustments of $150–200 per feature difference are standard. Add to the comp's rent if your property has a feature the comp lacks (covered parking, in-unit washer/dryer, renovated kitchen). Subtract if the comp has something yours does not.
- Build an adjustment table. List each comp, its asking rent, and your adjustments line by line. This creates an auditable record and forces you to be honest about your property's relative strengths and weaknesses.
- Average the adjusted rents. The mean of your adjusted comparable rents is your CMA estimate. If one comp produces a wildly different result, investigate why before including it in the average.
- Verify with live market data. Call the listing agent or property manager for each comp. Asking rents and signed lease rents often differ, especially in soft markets.
Here is a sample adjustment table for a 2-bedroom unit priced at an estimated $2,800/month:
| Comparable | Listed Rent | Parking Adj. | Renovation Adj. | Adjusted Rent |
|---|---|---|---|---|
| Comp A | $2,650 | +$150 | +$200 | $3,000 |
| Comp B | $2,900 | $0 | -$150 | $2,750 |
| Comp C | $2,750 | +$150 | $0 | $2,900 |
| Average | $2,883 |
Pro Tip: Always verify listed rents against actual signed leases by speaking directly with a local property manager. Asking rents in oversupplied markets can run $200–300 above what tenants actually pay.
How does the Income Approach work for rental valuation?
The Income Approach calculates rental value from the property's financial performance rather than from market comparisons. The core formula is: Rental Value = Net Operating Income (NOI) / Capitalization Rate (Cap Rate). This method is especially useful when comparable rentals are scarce or when you want to verify that your CMA estimate actually supports positive cash flow.
Follow these steps to apply the Income Approach:
- Estimate gross rental income. Start with your CMA rent estimate multiplied by 12 for annual gross income.
- Subtract vacancy loss. Apply a vacancy rate of 5–8% for a balanced market. The national rental vacancy rate in Q4 2025 was 7.2%, making 7% a reasonable baseline for most U.S. markets.
- Subtract operating expenses. Operating expenses typically consume 35–45% of gross rental income, excluding mortgage payments. Key line items include property management (8–12%), maintenance and capital expenditures (5–10%), property taxes, insurance, and utilities where applicable.
- Calculate NOI. Gross income minus vacancy loss minus operating expenses equals NOI.
- Apply the Cap Rate. Divide NOI by the local market cap rate to confirm whether your rent estimate supports the property's value. Cap rates vary by market and property class, so use a locally sourced figure from a property manager or recent sales data.
A worked example: A unit with a $2,883 monthly CMA rent generates $34,596 annually. At 7% vacancy, effective income drops to $32,174. At 40% operating expenses, NOI equals $19,304. At a 5% cap rate, the implied property value is $386,080. If the purchase price is significantly higher, your rent estimate may need to rise, or the deal may not pencil.
Pro Tip: Always estimate operating expenses at the high end of the 35–45% range when you are new to a market. Underestimating expenses is the single most common reason rental investments underperform in year one.
How do you analyze market conditions that affect rental demand?
Market conditions determine whether your rent estimate is achievable or theoretical. A property priced at market rent in a high-vacancy area will sit empty. One priced below market in a tight area leaves money on the table. Rent affordability relative to median income is a critical demand signal: rent should not exceed 25–30% of median household income, or you face elevated turnover and collection risk even when occupancy looks strong.
Watch these market indicators regularly:
- Vacancy rate: Below 5% signals a landlord-favorable shortage. Between 5–8% is a balanced market. Above 8% means oversupply and likely concessions.
- Rent-to-price ratio: Divide annual rent by purchase price. Higher ratios favor cash flow. Lower ratios favor appreciation. Know which you are buying.
- Job growth and employer diversity: Markets with a single dominant employer carry concentration risk. Diversified job bases support stable rental demand.
- "For Rent" signage density: Observing signage density in person reveals oversupply that online metrics miss. A street with five "For Rent" signs tells you more than a vacancy report.
- Manager test: Confirm that at least two competent local property managers operate in the area. If you cannot find two, the market is too thin to support reliable management.
A useful screening habit: a 30-minute market filter using rent-to-price ratios and job growth data can disqualify weak markets before you invest hours in a full analysis.
Common pitfalls when assessing rental property value
Most valuation errors fall into a small set of repeatable mistakes. Recognizing them before you run your numbers saves you from building a flawed investment case.
- Underestimating operating expenses. New investors routinely budget 20–25% for expenses. The real figure is 35–45%, and it climbs higher for older properties.
- Trusting automated rent estimates without verification. Algorithmic rent tools use listing data, not signed lease data. They can overstate achievable rents by a meaningful margin in soft markets.
- Ignoring affordability distortion. High market demand can be deceptive when tenant households are financially overextended. Occupancy looks strong until it suddenly does not.
- Skipping CMA adjustments. Averaging unadjusted rents from non-comparable properties produces a number that feels precise but is not grounded in your specific unit's features.
- Using a single valuation method. CMA alone misses cash flow risk. The Income Approach alone misses market rent reality. Use both.
"The most dangerous number in rental valuation is the one you did not stress-test. A rent estimate that only works under perfect conditions is not an estimate. It is a hope."
Key Takeaways
Accurate rental valuation requires combining CMA market data with Income Approach financial metrics, then stress-testing both against current vacancy rates and affordability conditions.
| Point | Details |
|---|---|
| Use two methods, not one | CMA sets market rent; the Income Approach confirms cash flow viability. |
| Expense estimates matter | Budget 35–45% of gross income for operating expenses to avoid year-one shortfalls. |
| Vacancy rate is a demand signal | Below 5% favors landlords; above 8% signals oversupply requiring rent concessions. |
| Affordability caps demand | Rent exceeding 30% of median household income drives turnover despite high occupancy. |
| Verify rents with managers | Signed lease rents often differ from asking rents; always confirm with local managers. |
Why I trust the boring math over the exciting market story
Velisa here. After years of watching investors overpay for properties in "hot" markets, I have one consistent observation: the deals that go wrong almost always had a compelling narrative and a weak spreadsheet. The neighborhood was "up and coming." The vacancy rate was "temporarily elevated." The expenses were "lower than average because the owner is handy."
The Income Approach does not care about narratives. It cares about NOI and cap rates. When I run a valuation, I use the CMA to anchor my rent estimate in market reality, then I run the Income Approach at the high end of the expense range to see if the deal still works. If it only works at 35% expenses and falls apart at 45%, I treat it as a marginal deal, not a good one.
The other thing most guides skip: the manager test. Before I finalize any rental valuation, I call two local property managers and ask what they would charge to manage the unit and what they think it would rent for. If their number is $200 below my CMA estimate, I use their number. They know the signed leases. I know the listings. Their data wins.
Continuous monitoring matters just as much as the initial assessment. Markets shift. A balanced 6% vacancy rate can move to 9% in 18 months if new supply enters. Build a habit of checking vacancy and rent trends quarterly, not just at purchase. That discipline is what separates investors who hold profitable rentals from those who wonder what went wrong.
— Velisa
Onemarinagardens: a real-world rental valuation case study

Onemarinagardens puts the valuation framework above into sharp focus. Located in District 01 of Singapore, just 160 meters from the Marina South MRT, the development sits in a location where transit access, CBD proximity, and skyline views directly support premium rental demand. For investors applying the CMA method, the mix of 1-bedroom to 4-bedroom units across 937 homes provides a clear comparable base within the same development. The Income Approach works cleanly here too: a well-specified unit with amenities including a 50-meter lap pool, sky terraces, and a dedicated childcare center commands rents that reflect the full feature set, not just square footage.
Onemarinagardens is developed by Kingsford Marina Development and offers units starting from $1.81M, giving investors a concrete price anchor for cap rate calculations. For a full picture of the project's rental income potential and long-term appreciation case, the investment overview covers the Marina South growth story in detail. To explore floor plans, specs, and current pricing, visit Onemarinagardens or contact the sales team to schedule a showflat appointment.
FAQ
What is the most reliable method to assess rental value?
Comparable Market Analysis is the most reliable starting point, using 3–5 matched properties with rent adjustments for feature differences. Combine it with the Income Approach to confirm cash flow viability.
What vacancy rate signals a healthy rental market?
A vacancy rate of 5–8% indicates a balanced market. Below 5% favors landlords with strong rent growth potential; above 8% signals oversupply and typically requires rent concessions to attract tenants.
How do operating expenses affect rental property valuation?
Operating expenses typically run 35–45% of gross rental income, excluding mortgage payments. Underestimating this range is the most common reason rental investments underperform in the first year.
How do I know if rental demand is real or inflated?
Check whether local rents exceed 30% of median household income. Affordability distortion creates apparent demand that collapses into high turnover and collection problems once tenants are financially stressed.
Can I assess rental value without paid data tools?
Yes. Publicly available sources including the U.S. Census Bureau, HUD Fair Market Rents, and local property manager consultations provide enough data for a defensible rental valuation without expensive proprietary platforms.