District 1 condos trade at a median of $2,223 per square foot, based on 1,842 URA transactions across 15 projects, with a typical unit changing hands around S$1,950,000. That's a luxury-tier market with genuinely limited residential stock, and prices swing month to month more than most districts because so few sales set the average. Anyone shopping here needs to read PSF and quantum together, not one without the other.
TL;DR:
- Buyers should focus on both PSF and quantum together, as larger units may have a lower PSF but higher total costs, especially in high-end projects.
- District 1 prices are highly volatile month to month because a few large deals can skew the average, making small sample sizes especially influential.
- Despite short-term fluctuations, the district's long-term trend remains upward, supported by limited land, steady rental demand, and premium views.
- Shorter leaseholds in District 1 can lose value over time, so lease duration must be a key factor in affordability and resale planning.
- Developers like One Marina Gardens offer new-build options that combine larger units with amenities, potentially providing better value than resale for some buyers.
Table of Contents
- What Are Condo Prices in District 1 Right Now?
- Why Do District 1 Prices Swing So Much Month to Month?
- How Should Buyers Read PSF and Quantum Together?
- Where Can You Track District 1 Listings and Transacted Prices?
- One Marina Gardens: A District 1 New-Build Case Study
- How Have District 1 Condo Prices Moved Over Time?
- How Do District 1 Prices Compare to Other Districts and the City Average?
- What Government Policies Affect District 1 Condo Prices?
- What's the Market Outlook for District 1 Condo Prices?
- What This Data Means for Different Types of Buyers
- Ready to Look at a District 1 New-Build?
- Sources
- FAQ
What Are Condo Prices in District 1 Right Now?
The clearest anchor for District 1 condo prices comes from CheckHowMuch's tracking of 15 projects and 1,842 URA transactions, which puts the median at $2,223 per square foot and the typical transacted unit around S$1,950,000. Prices in that dataset rose roughly 3.2% over the tracked window, a modest climb that masks a lot of month-to-month noise underneath.
Zoom into a single month and the picture gets choppier. ShiokNest's June 2026 market digest recorded 33 sales at an average of $2,394 psf, alongside roughly 192 to 194 new leases signed the same month. That's a small sample by any standard, and it's why District 1 numbers bounce around more than districts with hundreds of monthly transactions.
Some individual projects push well past the district median. PropertyHowMuch notes that several District 1 developments average above S$3,000 psf, reflecting the district's high-end positioning and a residential land share that's estimated at only around 20%, with commercial use dominating the rest.
| Source | Median PSF | Typical Quantum | Sample Size |
|---|---|---|---|
| CheckHowMuch (district-wide) | $2,223 | ~S$1,950,000 | 1,842 transactions, 15 projects |
| ShiokNest, June 2026 | $2,394 (avg) | Not separately stated | 33 sales |
| PropertyHowMuch (top-end projects) | $3,000+ (select projects) | Not separately stated | Project-level, not district-wide |
The gap between $2,223 and $2,394 isn't a contradiction. One is a broader median across a full dataset of projects; the other is a single month's average, which a couple of large-quantum sales can pull upward fast.
Why Do District 1 Prices Swing So Much Month to Month?
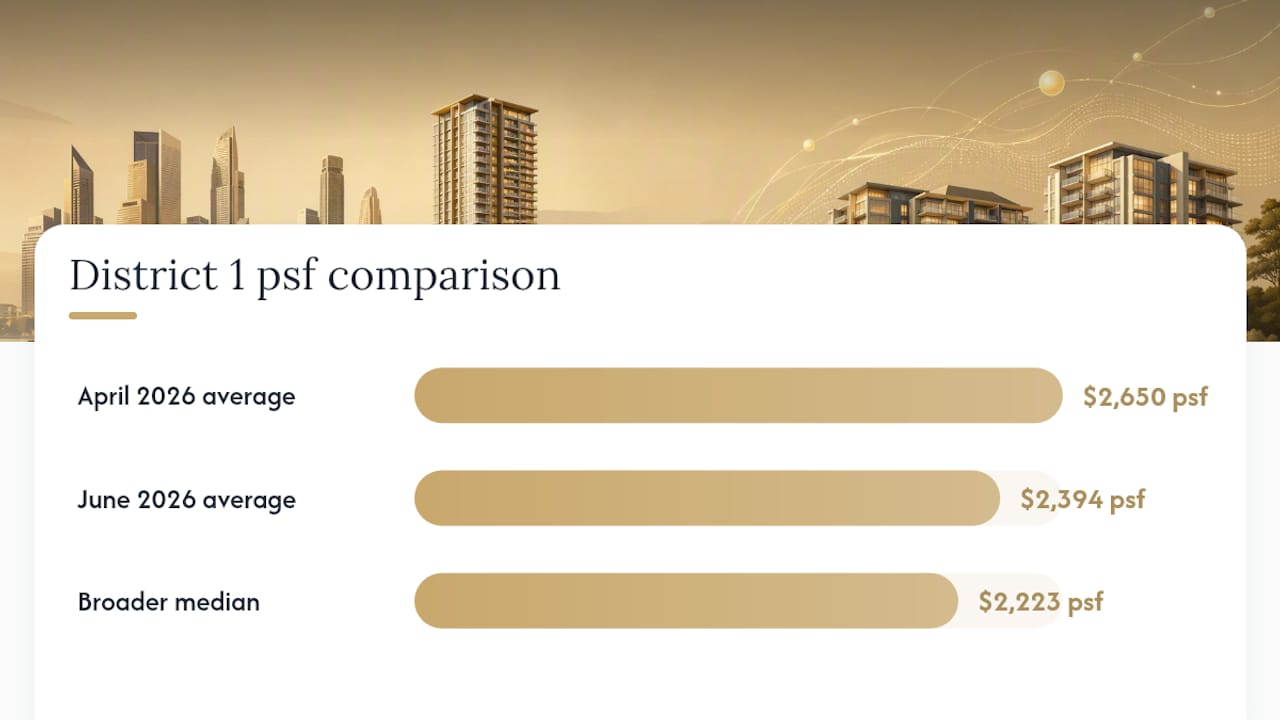
District 1's six-month trajectory tells a story of a market that runs hot, cools, and runs hot again. ShiokNest's April 2026 digest put the average at $2,650 psf across 53 sales, a stronger month than June's $2,394 psf across just 33 sales.
That kind of swing would be unusual in a district with hundreds of monthly caveats. In District 1, it's normal, because a handful of large sales can drag the average in either direction. A single record-setting transaction, like the Aman-branded Skywaters unit that reportedly sold near S$6,501 psf in October, illustrates how one signature sale can distort perceptions of where the "real" market sits.
Statistic callout: District 1's June 2026 average of $2,394 psf sits roughly 8% above the district's broader median of $2,223 psf, even after a month-on-month pullback, underscoring how persistently the district trades at a premium regardless of short-term dips.
A few forces keep District 1 pricing elevated even when volumes soften:
- CBD-adjacent demand from professionals and executives who want a short commute keeps rental interest steady even when sales slow.
- Investor appetite for skyline and Marina Bay views supports pricing on higher floors and premium stacks.
- Land scarcity limits new residential supply, since commercial use accounts for roughly 80% of District 1 land.
- Rental resilience outpaced sales in June 2026, with nearly 194 leases signed even as sales volume dropped, suggesting occupier demand puts a floor under pricing for well-located units.
Historical charting backs this up over a longer horizon. SBR's analysis of District 1 and 2 pricing found both districts have hit historical highs in past cycles, often driven by the same dynamic: a small number of large-ticket resales anchoring the whole district's perceived value.
How Should Buyers Read PSF and Quantum Together?
PSF tells you the rate; quantum tells you what you're actually writing a check for. In a district where units run large and finishes run premium, quantum often matters more than PSF alone, because a slightly lower PSF on a bigger unit can still mean a bigger total commitment than a higher PSF on a compact one.
Lease tenure changes the math too. Freehold and 999-year leasehold titles in District 1 tend to hold value more predictably over decades, while shorter leaseholds face decay in valuation as the remaining term shortens, particularly past the 60-year mark when financing options narrow.
Before making an offer, run it through this checklist:
- Test affordability at both peak and pullback PSF. Model your numbers against a recent high (like May's $2,766 psf) and a recent low (like June's $2,394 psf) to see your realistic range.
- Check the rental yield. Compare asking rent against your all-in purchase cost, not just the listed PSF.
- Review lease decay. Confirm whether the title is freehold, 999-year, or a shorter leasehold, and what that means for resale in 15 to 20 years.
- Weigh the floor and view premium. A unit two floors up with a clear Marina Bay sightline can command a meaningfully higher price than an identical layout facing a podium.
- Map the resale path. Ask which buyer pool you're selling into: owner-occupiers, expatriate tenants, or investors chasing yield.
- Budget for contingency costs. Stamp duties, legal fees, and renovation allowances all eat into your effective entry price.
Pro Tip: Don't anchor your budget to a single month's average PSF. Run your affordability model at both the recent peak and the recent pullback to see the real range you're working with before you commit.
Where Can You Track District 1 Listings and Transacted Prices?
Three types of sources cover District 1, and each shows something different. Property portals and agency listing pages show asking prices, which reflect what sellers want, not what buyers are actually paying. URA caveat records, the same data ShiokNest's market digests draw from, show prices actually lodged after a sale completes, which makes them the more reliable read on real market levels.
- Property portals and agency pages are useful for spotting new listings and gauging seller expectations, but treat the PSF shown as a starting point, not a transacted fact.
- URA caveat data reflects prices actually paid, making it the standard for verifying whether an asking price is realistic.
- New-launch release schedules are worth watching directly, since developer pricing on a fresh project often resets the district's psychological benchmark.
Reconciling the two is simple in practice: if a listing's asking PSF sits well above the latest caveat-based average for comparable units, treat it as a negotiation starting point rather than the market rate.
One Marina Gardens: A District 1 New-Build Case Study
One Marina Gardens illustrates the premium dynamics running through District 1 pricing. The 937-unit development from Kingsford Marina Development sits just 160 meters from Marina South MRT, with unit types spanning 1-bedroom to 4-bedroom layouts, a 50-meter lap pool, multiple sky terraces, and an on-site childcare centre inside a mixed-use setting with retail and dining.
Those features track directly with what tends to support higher PSF and quantum in this district: proximity to CBD transit, resort-style facilities that are rare in older stock, and Marina Bay skyline views from upper floors. ShiokNest's April 2026 digest noted One Marina Gardens among the properties driving multiple high-PSF new sales that month, consistent with the district's broader pattern of premium new-builds pulling averages upward.
The development suits owner-occupiers who want CBD convenience without sacrificing family-friendly amenities, and long-term investors betting on District 1's structural supply scarcity. Reviewing the fact sheet is a reasonable next step before comparing it against resale stock.
How Have District 1 Condo Prices Moved Over Time?
District 1 has a pattern of reaching new highs, cooling briefly, then climbing again, largely because its transaction volume is thin enough that individual sales carry outsized weight. SBR's chart analysis found both District 1 and District 2 have hit historical price highs in past cycles, often coinciding with a cluster of large resales rather than a broad-based rally.
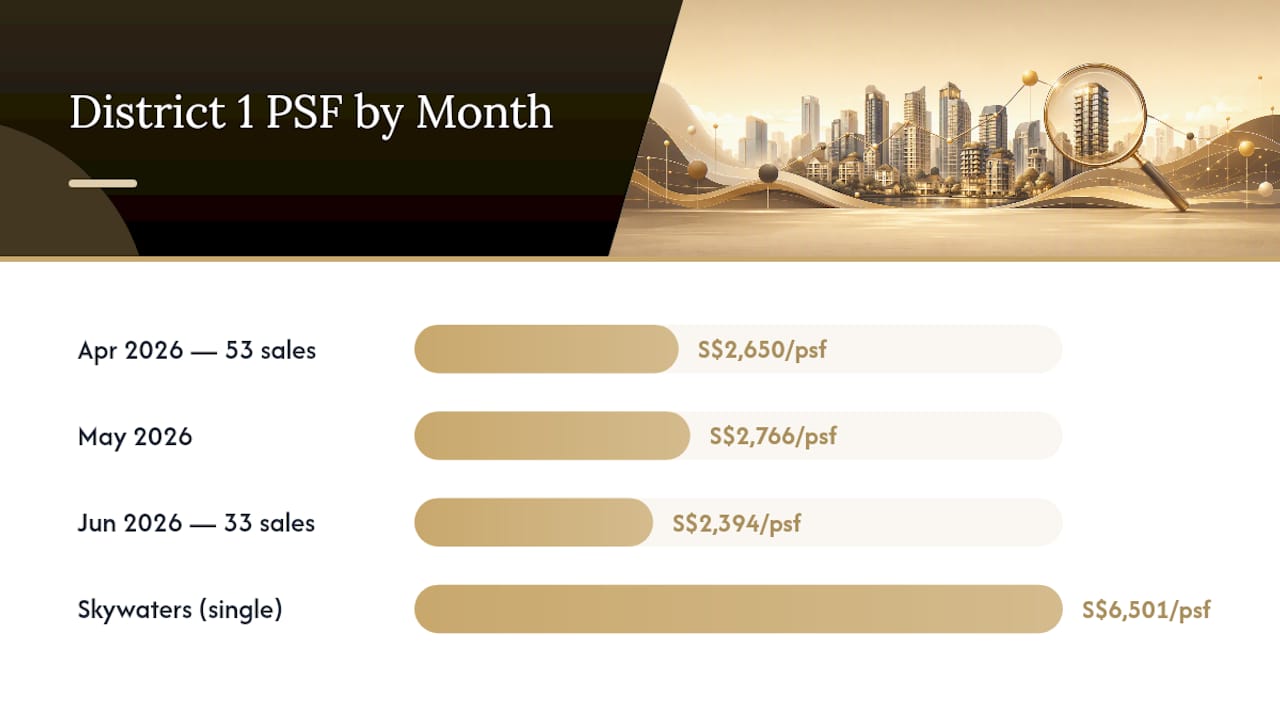
That pattern held again through the first half of 2026. April brought 53 sales averaging $2,650 psf, May reportedly pushed higher to around $2,766 psf, and June pulled back to $2,394 psf across just 33 sales. Viewed as a single line, that's volatility. Viewed as a district where a handful of penthouse or branded-residence resales can move the needle, it's closer to normal.
The Skywaters transaction near S$6,501 psf is a useful reference point for how far above the median a single signature sale can sit. It doesn't represent typical District 1 pricing, but it shows why relying on one month's average, without checking the underlying sample size, can mislead a buyer into thinking the whole district has repriced when really one unit did the heavy lifting.
For buyers building a long-term view, the takeaway isn't that District 1 is unstable. It's that the district's small sample size means short-term averages need context, while the multi-year trend of hitting fresh highs suggests structural scarcity keeps pushing the ceiling upward over time.
How Do District 1 Prices Compare to Other Districts and the City Average?
District 1's $2,223 psf median sits well above what most buyers would pay across Singapore's broader private condo market, reflecting its status as one of the country's most land-constrained districts. PropertyHowMuch's profile of the district attributes much of that premium to the roughly 80% commercial land share, which leaves a genuinely small pool of residential addresses competing for buyer attention.
The premium isn't unique to District 1 alone, but District 1's residential scarcity tends to make its swings sharper in both directions.
For context on how view and floor positioning specifically add to that premium within the district, the analysis of what bay views add to District 01 pricing breaks down the dollar impact in more detail. Broader comparisons across top-tier Singapore developments, including how District 1 stacks against other prestige addresses, are covered in this buyer's guide to Singapore's best condominiums.
The practical takeaway: comparing District 1's PSF to a citywide average is a bit like comparing a boutique hotel's room rate to a chain's nationwide average. The comparison is technically valid, but the product, location, and buyer pool are different enough that the gap tells you more about scarcity than about District 1 being "overpriced."
What Government Policies Affect District 1 Condo Prices?
Singapore's cooling measures, including Additional Buyer's Stamp Duty (ABSD) and loan-to-value limits, apply nationwide, but their effect on District 1 shows up differently than in mass-market districts because a larger share of District 1 buyers are investors and foreign purchasers rather than owner-occupiers hunting for a first home.
Higher ABSD tiers for foreign buyers and multiple-property owners tend to hit District 1 demand more directly than districts dominated by HDB upgraders, since the district's buyer pool skews toward exactly the categories these measures target. When ABSD rates rise, transaction volume in prestige districts like District 1 often cools first and recovers slower, because the buyers most affected are also the most price-sensitive to holding costs.
At the same time, land-use policy plays a quieter but arguably bigger role. Any signal of new residential land releases in the district tends to draw significant buyer attention precisely because such releases are rare.
Property tax changes for high-value and non-owner-occupied residential units also weigh more heavily on District 1, where quantum runs high and a meaningful share of stock is investor-held rather than owner-occupied. Buyers should factor holding costs, not just purchase price, into any long-term District 1 investment decision.
What's the Market Outlook for District 1 Condo Prices?
The most defensible forecast for District 1 isn't a single number. It's a range shaped by the same volatility already visible across April, May, and June 2026, when averages moved from $2,650 psf to roughly $2,766 psf and back down to $2,394 psf inside one quarter.
Structural scarcity argues for continued upward pressure over the medium term.
Rental demand offers a useful leading indicator. June 2026's near-194 new leases, holding up even as sales volume dropped, points to steady occupier demand from CBD workers and expatriates that should continue supporting rents and, by extension, investor appetite for yield-generating units.
The honest outlook for prospective buyers is this: expect continued month-to-month noise driven by low transaction counts, but don't mistake a single soft month for a trend reversal. Watch caveat counts and new-launch pricing closely over the next two to three quarters rather than reacting to any one month's average.
What This Data Means for Different Types of Buyers
Long-term investors have real reason for cautious optimism here. Structural scarcity and steady rental demand support the case for holding through short-term PSF dips. Short-term flippers face a harder path. Thin volumes mean exit timing matters enormously, and a buyer forced to sell into a soft month like June risks realizing a price well below what May's numbers suggested was achievable.
Three indicators are worth checking every quarter: monthly caveat counts, the PSF trendline across consecutive months, and new-launch pricing whenever a project releases. Whatever your strategy, stress-test affordability across both the recent peak and pullback PSF before signing anything.
— Velisa
Ready to Look at a District 1 New-Build?
If you've been weighing resale stock against something newer, One Marina Gardens gives you a direct way to buy into District 1 without competing for a limited pool of older resale units. Its 937 units span 2-bedroom, 3-bedroom, 3BR Premium, and 4BR Premium layouts, all within 160 meters of Marina South MRT and built around a 50-meter lap pool, multiple sky terraces, and an on-site childcare centre.
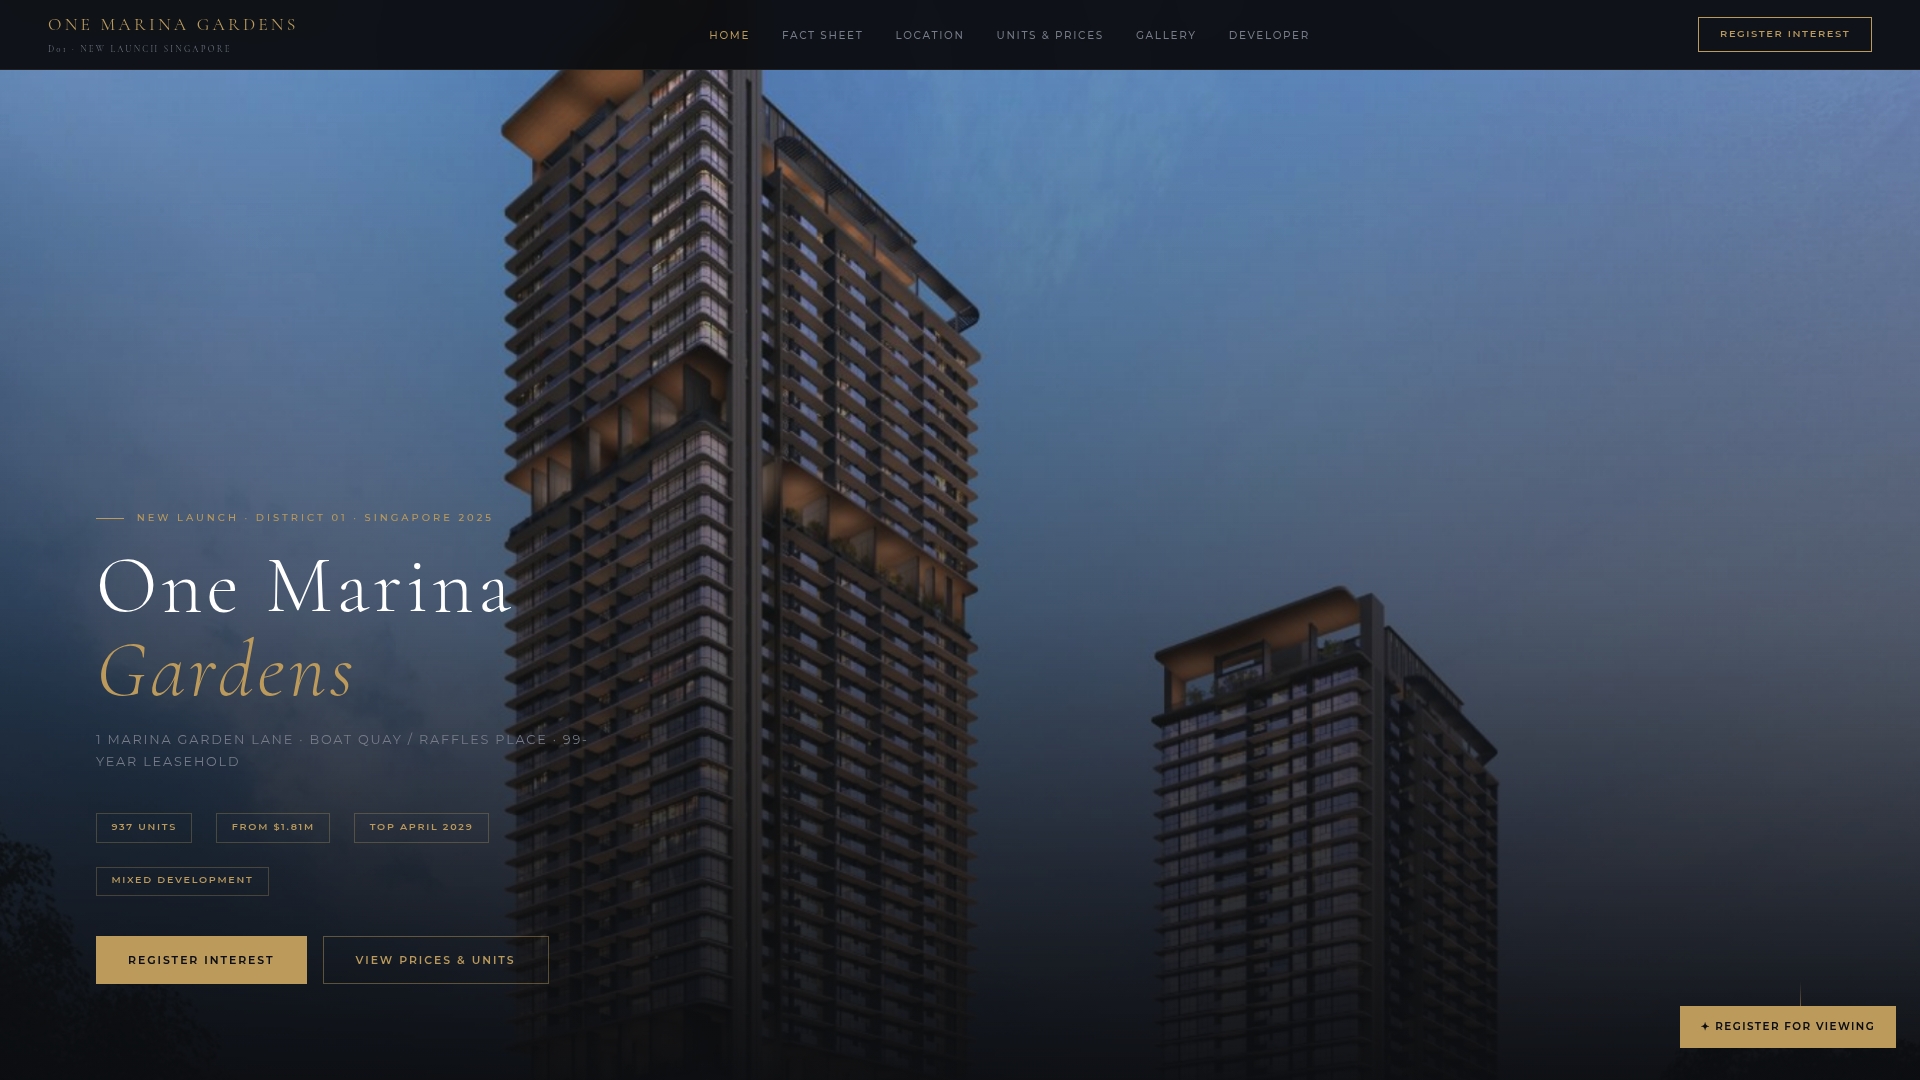
That mix matters if you're comparing quantum against amenities rather than PSF alone. A resale unit in an older building might come in cheaper per square foot, but it likely won't offer the same facility package or the same walk to the MRT. To see what's currently available, browse the units page for floorplans and layouts, or check the full price list for current availability starting from $1.81M. For technical specs and unit distribution details, the fact sheet covers the project in full. Booking a showflat visit is the fastest way to see how the layouts and views compare against whatever else you're considering.
Sources
- District 01 Condo Prices 2026: 15 Projects, Median $2,223 psf | CheckHowMuch
- Shioknest
- District 1 | PropertyHowMuch
- Chart of the Day: Private condo prices in districts 1 and 2 hit historical highs | SBR
This article is general information, not a substitute for advice from a qualified financial advisor. Consult a qualified financial professional about your own circumstances before acting on anything here.
FAQ
Where Is the Cheapest Condo in Singapore?
The cheapest condos in Singapore are typically found farther from the CBD scarcity that drives District 1's premium. District 1 sits at the opposite end of the spectrum, with a median around $2,223 psf, reflecting its limited residential land and waterfront positioning.
What Happens After 50 Years Living in a Condominium?
For leasehold condos, the remaining lease term shortens with each year, which typically affects resale valuation and financing options as the lease decays toward zero. Freehold and 999-year leasehold properties, common in parts of District 1, don't face this decline the same way, which is why lease tenure should factor into any long-term purchase decision.
What Is the Current Price Trend for Condominiums in Singapore?
District 1 pricing has shown notable month-to-month swings recently, moving from an average of $2,650 psf in April 2026 to roughly $2,766 psf in May, then pulling back 13.1% to $2,394 psf in June. The broader district median sits at $2,223 psf, suggesting the underlying trend is a gradual climb interrupted by short-term volatility tied to low transaction counts.
Will Singapore Property Prices Drop in 2026?
No single data point points to a broad price drop; District 1's June 2026 pullback reflects month-to-month volatility from small sample sizes rather than a sustained downturn. Rental demand stayed firm with nearly 194 new leases signed in June even as sales cooled, suggesting underlying demand remains intact for well-located units.
What Does a Unit at One Marina Gardens Typically Cost?
Current prices for One Marina Gardens units start from $1.81M, with the full price list and availability updated on the developer's site. Unit types range from 2-bedroom to 4BR Premium layouts, so exact pricing depends on floor, view, and configuration.